Today I sold all my stocks
Right click the graph and choose open the graph in a new tab to see it clearly
Today I sold all my stocks. On May 17th, I entered the market for the time. Till today, I received a total return of 11.62% in two and a half month, which I considered a not bad return. I have reasons that I need to sell my stocks - both personal and environmental. Personally, I become nervous and feel difficult to understand the market. At this period, I tell myself that it is a good choice to leave away from it for a while. The more important thing, however, is the environment.
As the market goes higher and higher, it becomes riskier and riskier. Mr John Hussman wrote in his weekly comments
There’s a field in one of our data sets that rarely sees much play, being driven primarily by only the most extreme combination of overvaluation, overbullish sentiment, and overbought conditions we’ve identified across history. It’s one of a variety of such syndromes we track, and I’ve simply labeled it “Bubble,” because with a single exception, this extreme variant has only emerged just before the worst market collapses in the past century. Prior to the advance of recent years, the list of these instances was: August 1929, the week of the market peak; August 1972, after which the S&P 500 would advance about 7% by year-end, and then drop by half; August 1987, the week of the market peak; March 2000, the week of the market peak; and July 2007, within a few points of the final peak in the S&P 500, with a secondary signal in October 2007, the week of that final market peak.
I sincerely hope the same thing will not happen in 2016.
In my daily thoughts on the market, I once wrote my framework of analyzing stocks. The number 1 rule I wrote down is Macroeconomic environment. It should be weighted 50% of the whole framework. Although I am not either a economic person or a dude who really understands fundamentals, several figures make me feel nervous and see a bigger opportunity right in the corner.
Markets have cycles. Some people call it “boom-bust” cycle. The winner of a market is able to see the downturn. A quote by Howard Marks describes the downturn as “When people see real returns of market not satisfying their expected returns, the market is making a turn.” I really love this quote because it emphasizes the importance of people’s expectation. All these expectations come from Macroeconomic data and Micro company data. Let me show some figures.
All figures below come from FRED
TED spread is number that generally reflects the liquidity in the market. A high TED spread means a tight credit environment. However, as we know, liquidity is the blood of stock markets. A climbing TED spread may presage a declining in stock market. 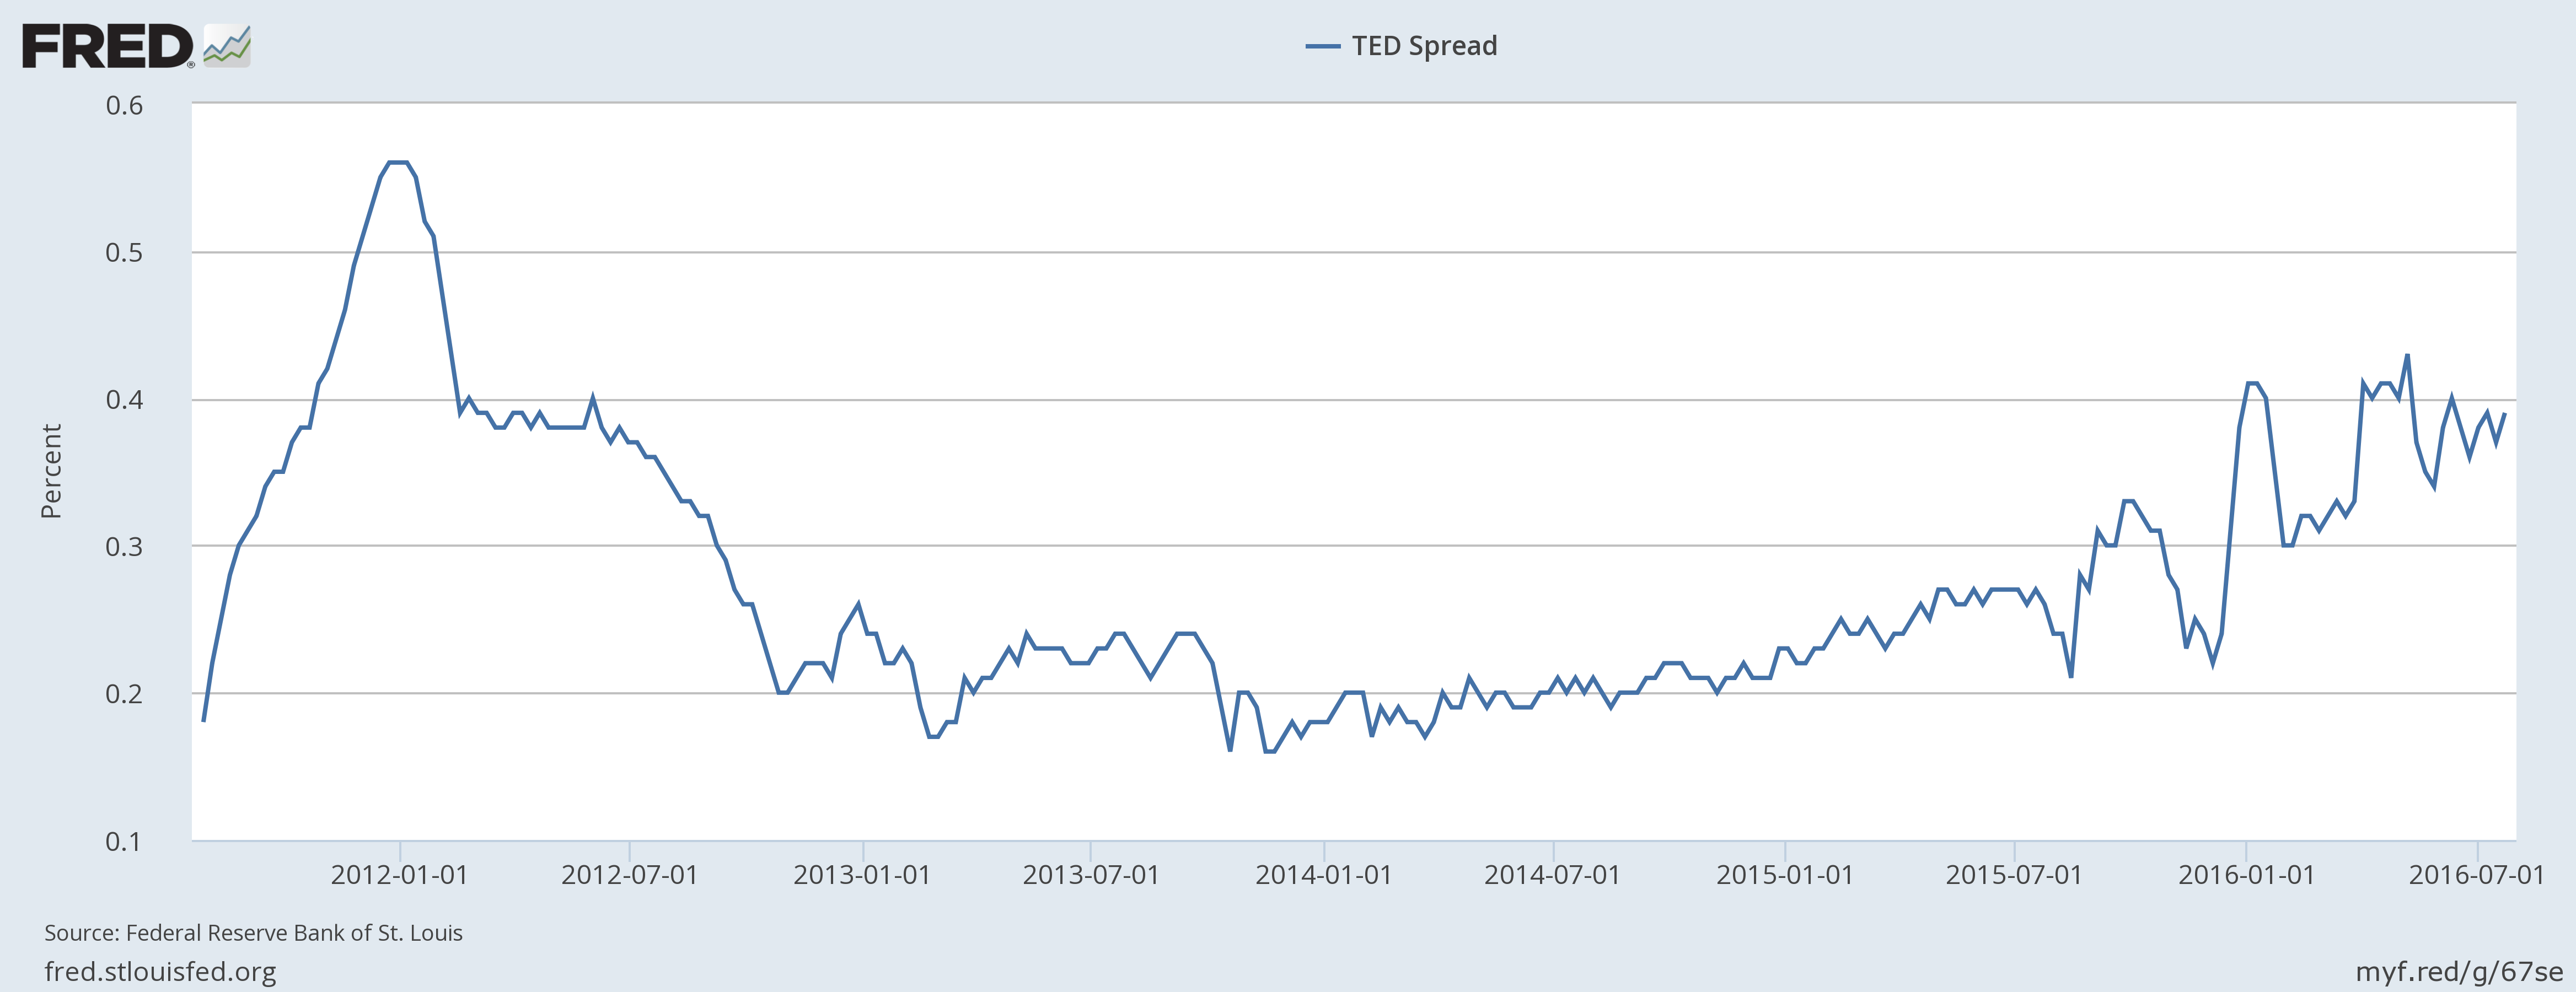 Current TED spread is 40 bps - the highest after 2012. This phenomenon gives the probability of a potential downturn.
The second one is Corporate Profit Change (YoY)adjusted by inventories and tax. 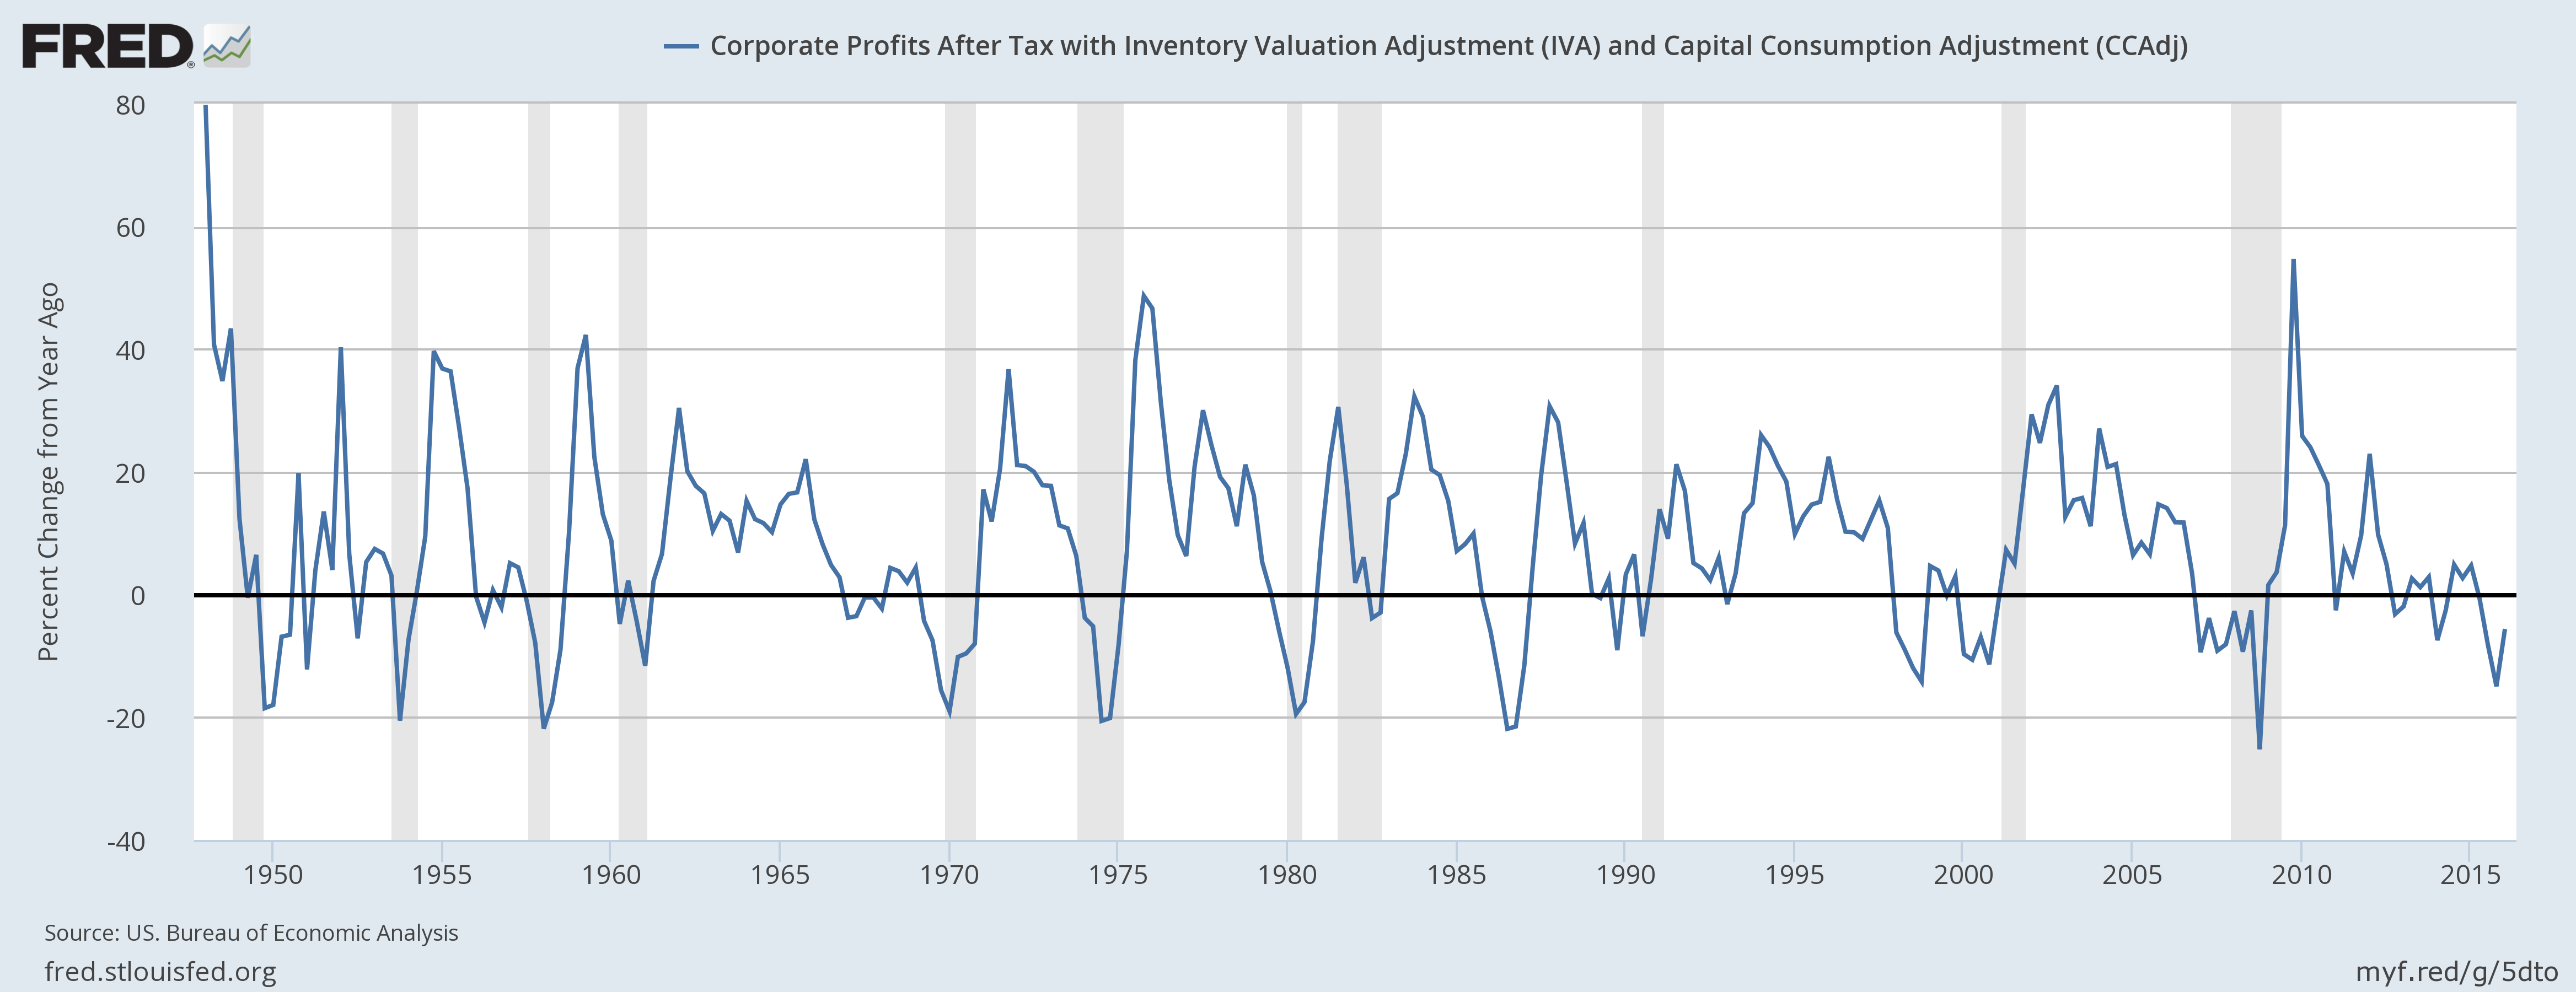 The grey parts stand for recessions. As we can see, every time when the number went less than 0, there was an recession. OK, you might say “What about the one around 1987?” Don’t you remember Oct 19th 1987? During the interview with Jack Schwager, Paul Tudor Jones said that his company had expected a huge market crash for 2 years before the Black Monday. When he saw the pattern on Oct 16th 1987, he knew the moment was coming (then he informed Stan Druckenmiller - my favorite money manager). When I read to this place, I was surprised by how PTJ could anticipate 2 years before it happened. From the figure, maybe there is an answer (Indeed, some following figures also show a pattern starting from 1985).
Second point is about Debt. Let me show two figures. 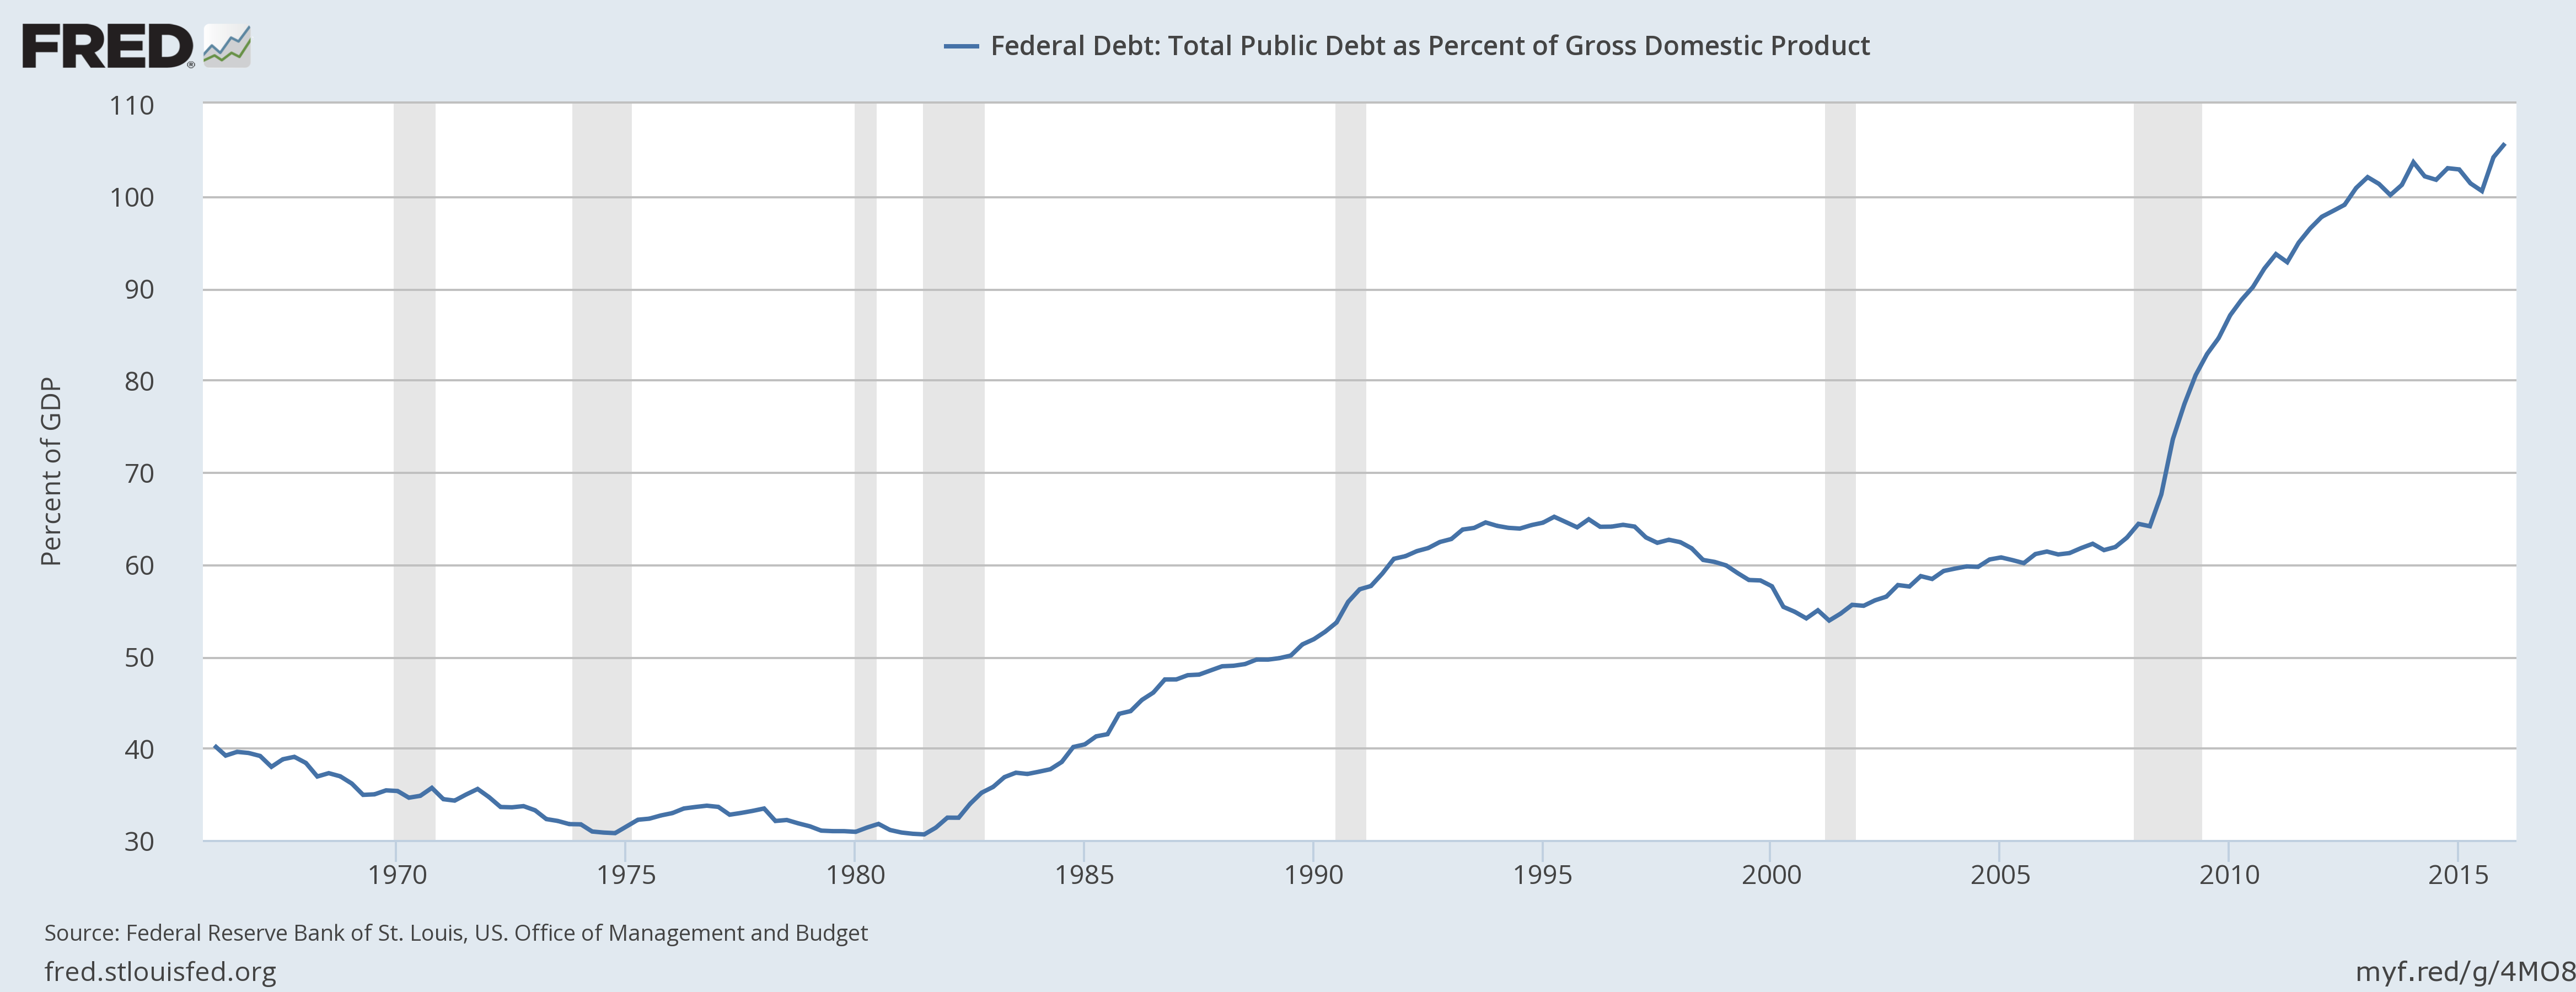 This figure simply tells the current situation. Debt/GDP is over 100%. This is even worse than 2008. I am wondering if 2008 recession has helped USA deleverage. From this figure, I cannot imagine what will happen if a recession starts.
The Government has been using debt to drive GDP(output). Based on our quote above - if the use of debt does not work, the downturn will start. Let’s look at the third figure. 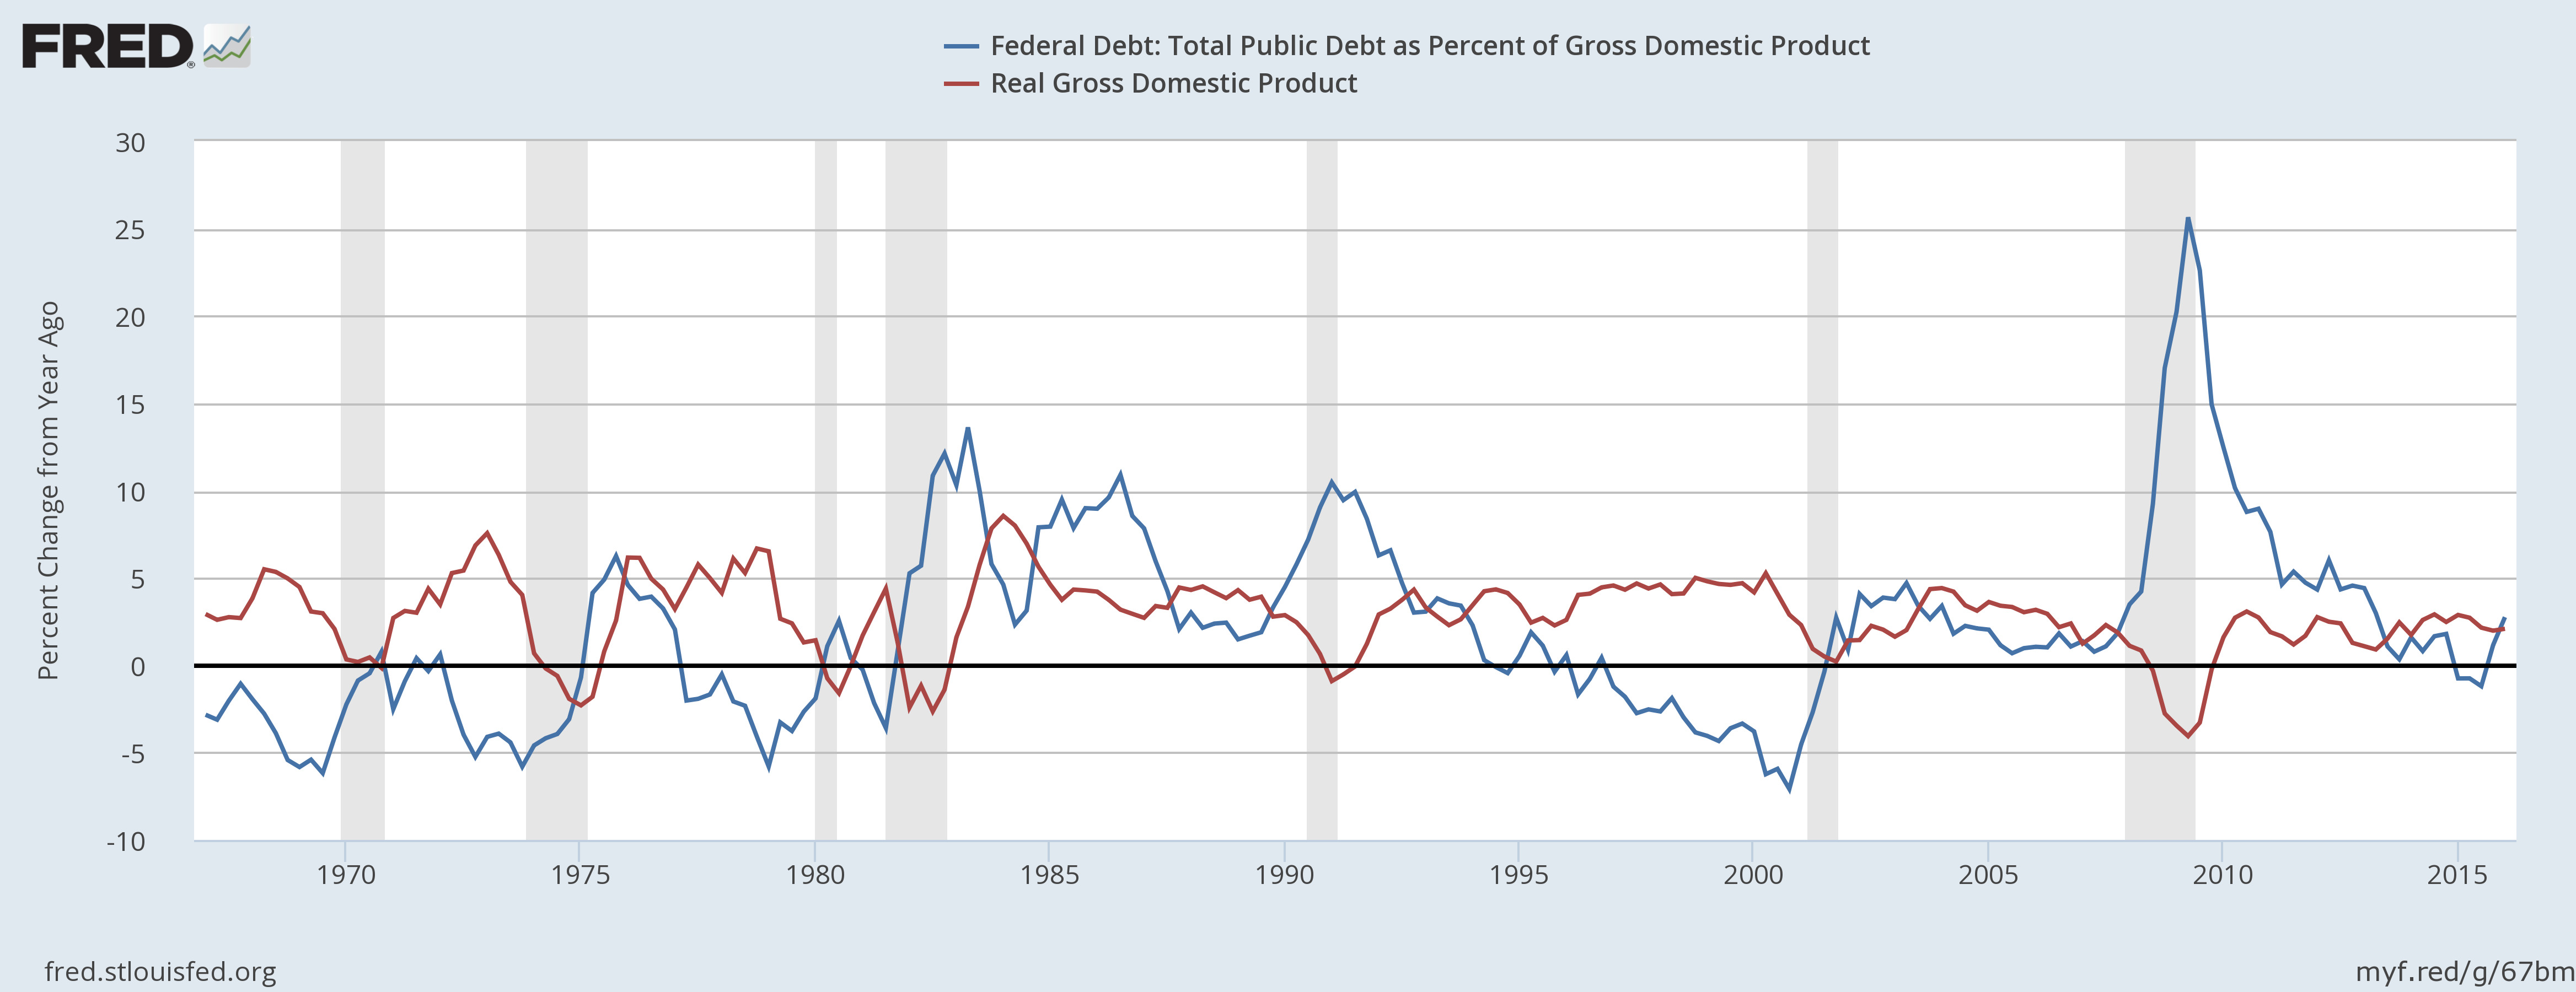 This is YoY Percentage change of Debt/GDP and YoY Percentage Change of GDP. Recessions happen when the blue line(Debt/GDP) goes up and cross the downward going red line(GDP). This is exactly what the quote says. The 2016 pattern tells that “If Real GDP in 2016 does not meet the expectation, the game is on.” And please read this news
Last point is about Industrial Production. Yes, I am talking about the OUTPUT, which I believe is the key factor of Macroeconomy. It is a mirror of GDP since GDP is also about output. However, industrial production is like the beginning, and GDP is like the ending. 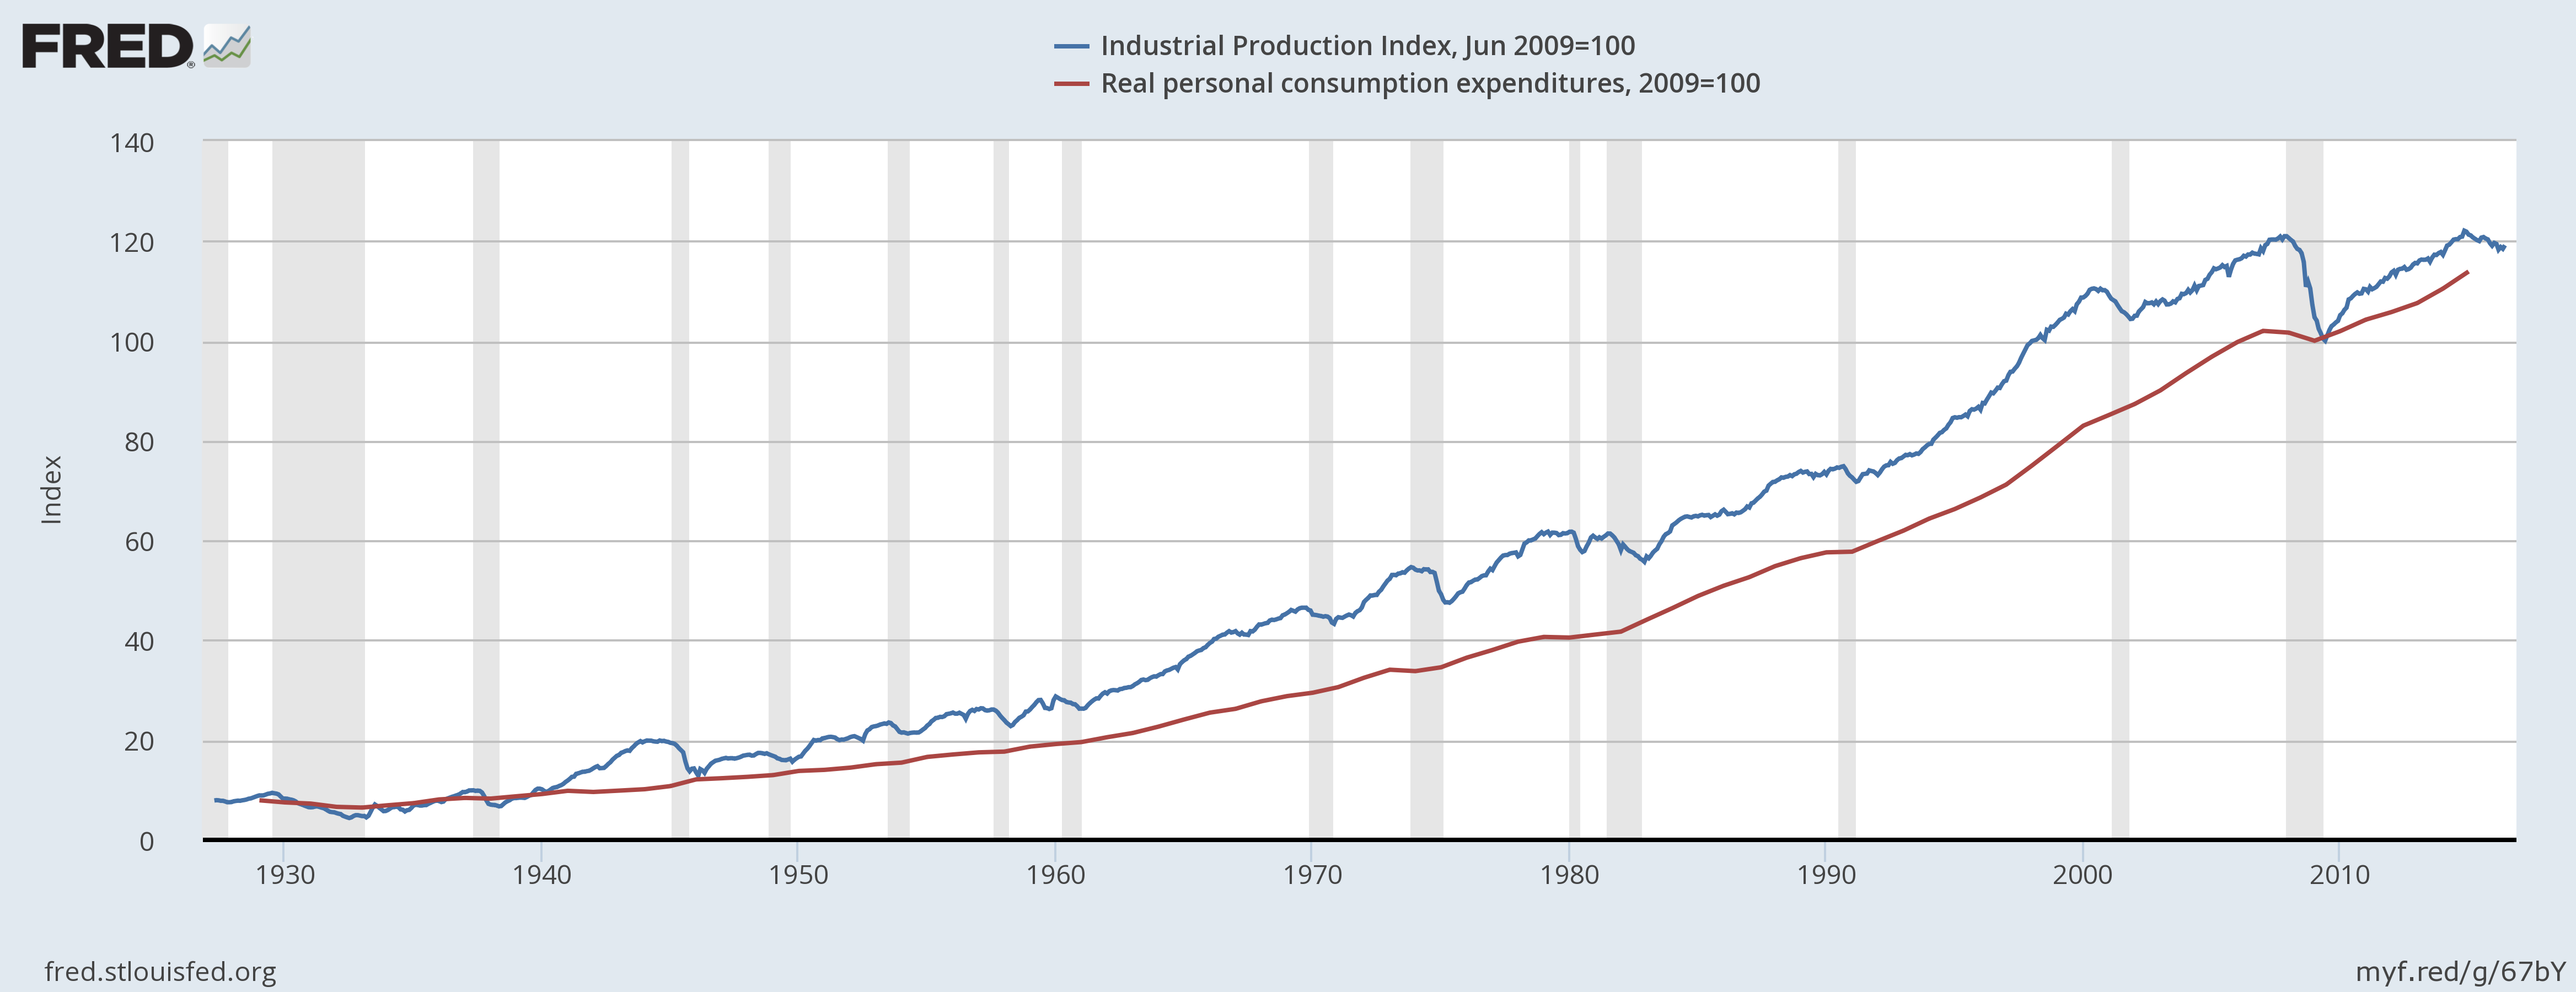 This is also a normalized figure. The good thing is that it has a long enough historical data. What I want to say is that every time when these two lines cross, something not good is happening. These things are even not recessions, but they are depressions. Take a look at the trend, um….
If all above figures are still not persuasive, the last one is very interesting. It is the change of Industrial Production (yes, the blue line in the last figure). 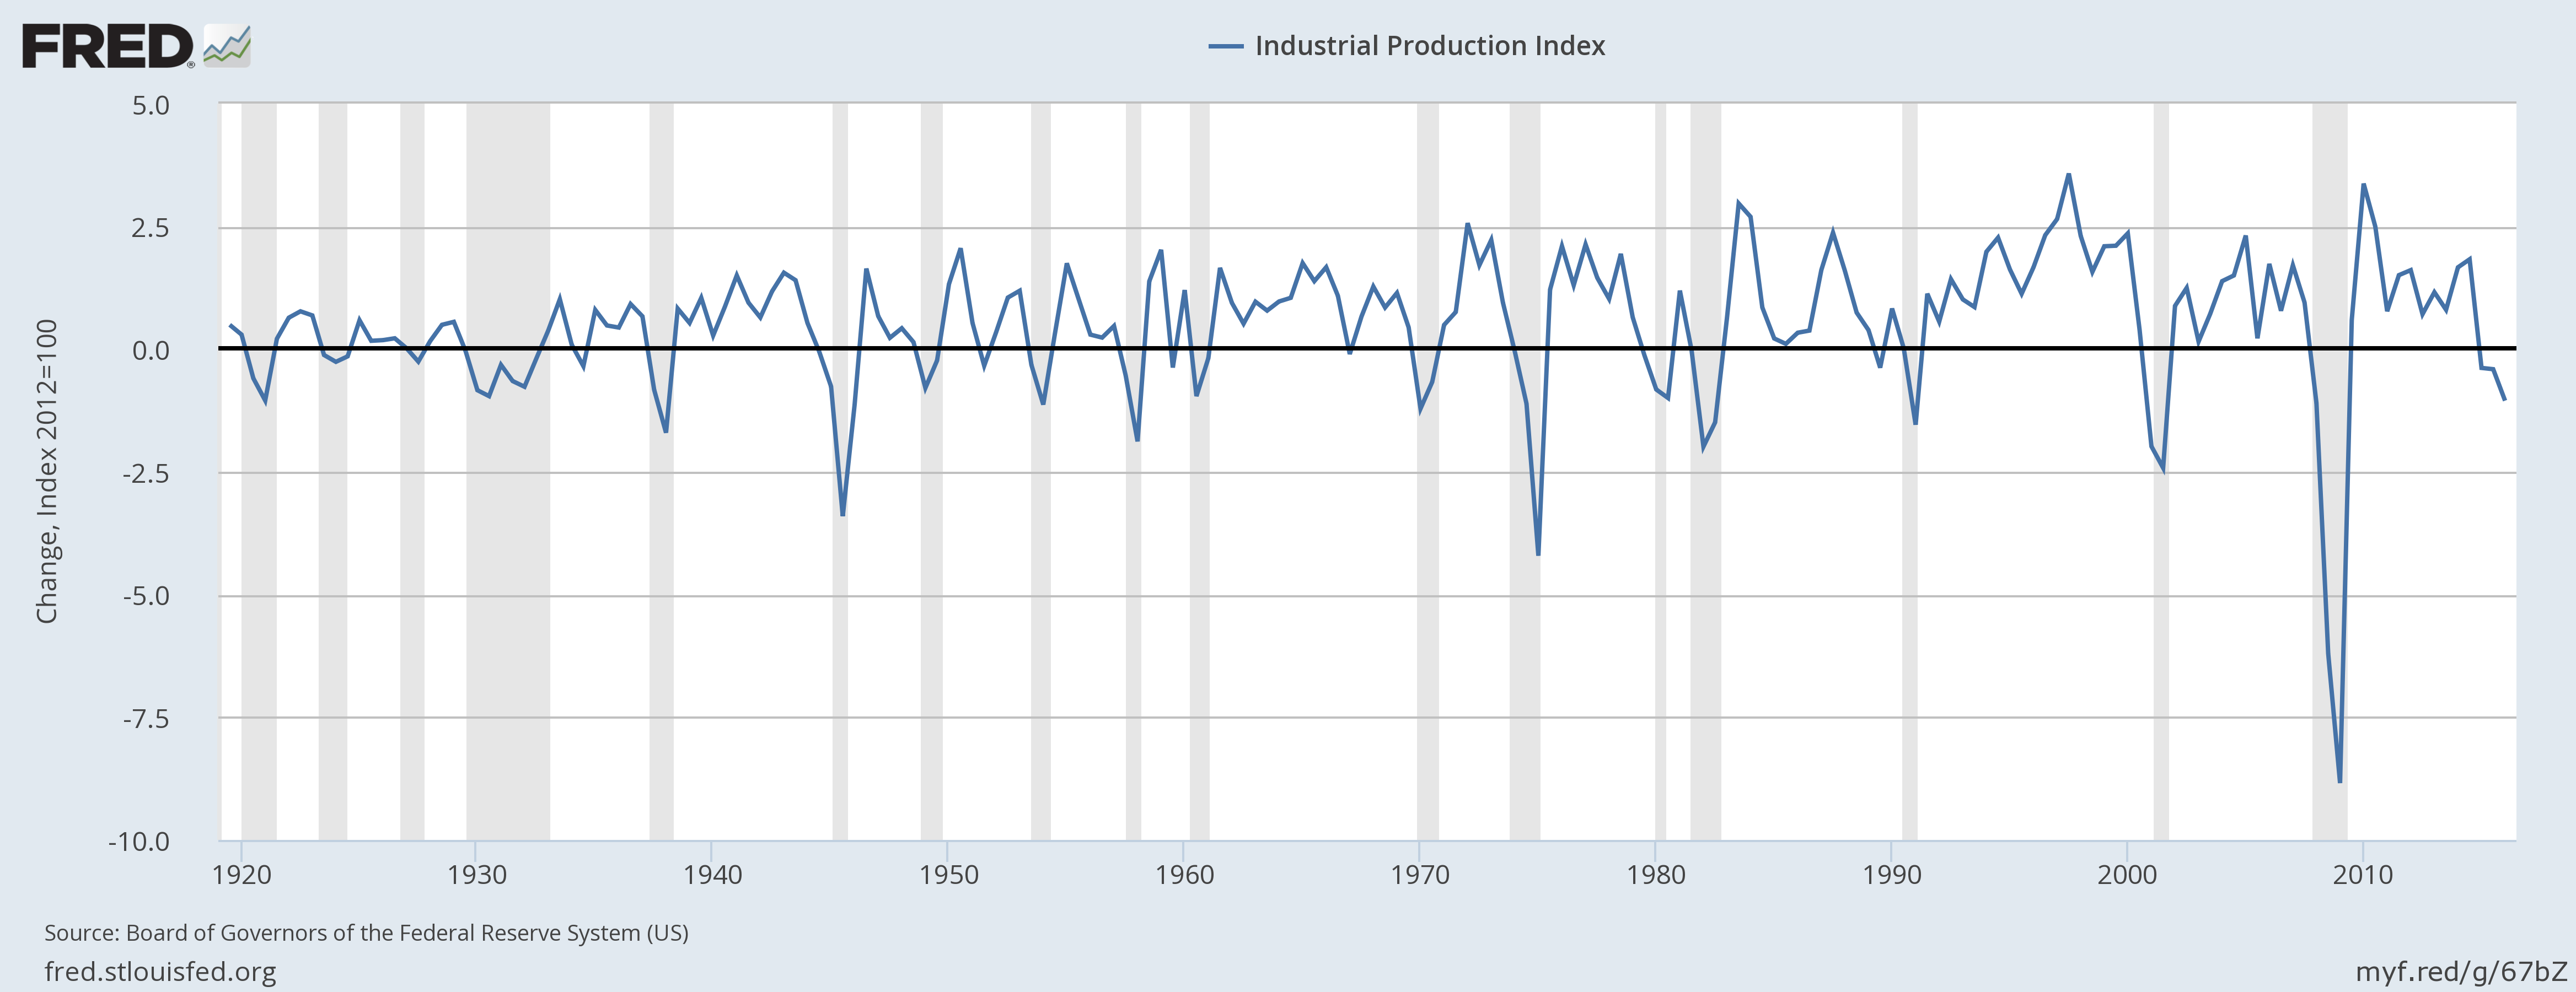 Remember, grey areas stand for recessions. During the past 80 years, when this number is less than 0, 100% recession happened. It looks like we are entering another one (or maybe we are already in one?).
I do not know whether coincidences works here. However, these graphs suggest at least a high probability of entering a recession.
From the point where we are standing now, there are many triggers - Fed, Japan, China, Euro Debt and Presidential Election. All these things keep me away from touching the market. Unless I see a great speculating opportunity, I may be away for a while. During this time, I would love to study more on Macroeconomy, financial history(especially crisis history) and Fed. Even, I can put some of my time on Technical Analysis. Mr. Market is always the best mentor.
Announcement: All contents above stand for my own view. Before May 17th, I literally had no idea about financial markets. Some of my views can be very naive. So, do not take them seriously.